MemLeakCheck
Detect memory leaks and also auto free them
July 19th 2003 (UK time)
Intro, Can it be used with multi-threaded apps?, Example of it in use, Memory leak checks in compilers, How to use it as source code, Using MemLeakCheck as a dll, Details of how it works, Download, Changes
Intro
See also discussion of this article at Code Project: Mem Leak Check Article
This source code can be used to detect memory leaks. It can also be used in another way to automatically free any memory that got allocated. The method used is fast, and requires little in the way of extra memory - for the auto free it only needs about 10 extra bytes per pointer on average when numbers of pointers are large. The diagnostics require about 22 extra bytes per pointer (one of those is a pointer to the file name which is a static string added to your code by the compiler, sowill not add any extra memory per allocation apart from the pointer to it).
The code is designed for use with malloc and free type routines only. However the idea could be extended to other types of memory allocation too - any method that uses a pointer to address the memory can be adapted easily..
The code is plain C. It is not specific to windows in any way. The code to make it thread safe is Windows specific.
In its present form the library is most useful to C programmers. I wonder if perhaps the idea could be extended to C++ but if that's so, I'm not the one to do it. It's implemented for the most commonly used routines malloc, realloc, calloc, free and strdup.
If you use the rarer _expand, _msize, or the wide string versions of strdup etc, then you will need to modify the source accordingly to add them in, which should be easy enough following the pattern of the ones already there - let me know if you need help with this.
Can it be used with multi-threaded apps?
Yes, in Windows. The dll is thread safe. It will also be fast in a multi-threaded environment if thread contention for the routines in the library is rare, in that case there should be no noticable performance penalty at all. Even if contention is frequent it may not impose that much of a performance penalty - see below.
It is also an easy matter to make the source code version thread safe, for Windows at least.
Just uncomment this line in the header:
#define MAKE_WINDOWS_THREAD_SAFE.
This uses InterlockedExchange in preference to critical sections, as this method is far faster if thread contention is exceedingly rare.
It is done like this:
long thread_lock;

#define SPIN_AND_GET_ACCESS \
{\
 for(;;)\
 {\
  if(InterlockedExchange(&thread_lock,1)!=0)\
   /* prior value for thread_lock was 1 so another thread*/\
   /*still has access*/\
   Sleep(0);\
  else\
   /*prior value was 0 and it is now set to 1 to*/\
   /*indicate that this thread has access*/\
   /*Now everything we do is atomic*/\
   break;\
 }\
}

#define CEDE_ACCESS  {InterlockedExchange(&thread_lock, 0);}
In the case where you do have contention then this turns into an efficient busy wait. The Sleep(0) surrenders the rest of that time slice (which will probably cede to another thread for several milliseconds). So, the busy wait uses only a few assembly language instructions per time slice and I'd have thought it won't have much of a performance impact even if you have some contention.
If you have a lot of thread contention, it does mean that some of your threads are continually ceding their time slices while others allocate memory -in effect lowering their priority, maybe to about the same as priority idle (at a guess). So I suppose perhaps it is as if only the thread currently involved in memory allocation at any time is working at normal priority in this situation and one might notice ones app slowing down if there are other cpu intensive ones in use at the same time. But here I'm not speaking from experience. I'll be interested to hear if anyone uses it in such a situation and what their findings are in practice.
One could alternatively declare all the global variables and arrays in this code to be thread local using __declspec (thread) (in MSVC). Maybe this approach would be worth investigating.
Thread local variables shouldn't be used in DLLs that may be loaded using LoadLibrary(). You would need to use thread local storage as a replacement for them if you want to try that approach in a DLL.
See the Microsoft article Dynamic-Link Library Data
Example of it in use
This shows the type of report you get:
As you see, it reports the line where every allocation occurred, and the size of each one. You can also sort the allocations according to file, then line. Finally you can sort by size if you have several memory sizes possible for the same line of code - as happens here with two allocations on line 8 of allocate_many_pointers.c. However, this sort is slow if you have many thousands of pointers in the report, so is optional.
Also it reports any attempt to free a pointer that wasn't recorded as allocated - assumed to be a wild pointer. It doesn't get freed - if you call free(..) on a pointer that wasn't recorded as allocated, the bug report gets generated but no attempt is made to free your pointer.
Probably an actual example would be helpful here. I needed to deal with memory leaks in an application written for Linux and to be used in a situation where memory leaks are not an issue.
Here is the report that MemLeakCheck generated:
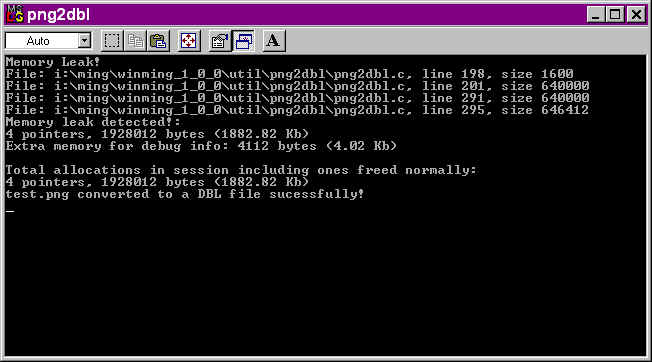
Here the 4.02 Kb for debug info consists mostly of an array which gets initialised to be large enough to hold 1024 pointers first time it is made - most of which didn't get used as only 4 pointers were needed.
If this were ones own program, one would probably now go through and fix the leaks, which as you see are quite substantial, nearly two megabytes. That's no surprise as it is converting an image from one format ot another
However this is someone else's code. The program only gets called once every time you want to convert a png file to a dbl, and it is relying on the operating system to automatically free the memory when it exitsl. It is a well and carefully written program and I prefer not to change the code where possible.
So, the easiest and also the best thing is to automatically free the memory instead.
So - easy to do. Just keep it linked with MemLeakCheck - and for the release build, switch off the diagnostics, and it will still auto free all the pointers when the program exits. This is what I did.
This idea can be used for a leaky dll. Maybe when a routine in the dll gets called it allocates some memory - and maybe once it exits then none of the memory it allocated is needed any more. If this is the situation then you could use MemLeakCheck to auto free all the memory on exit from the routine. Or otherwise, at least one could free the memory if the dll gets unloaded.
In fact I did exactly that here as well - I wanted to convert png2dbl to a dll for apps to call to convert png files to dbls - and there it was possible to auto free the memory every time the Png2DBL(...) routine returned. So - instead of leaking a MB or so every time an image gets converted, by linking it with MemLeakCheck, the dll has no memory leaks any more, with no noticeable performance impact.
Memory leak checks in compilers
Now before we go any further, you may not need the diagnostics, as your compiler may already have methods available for detecting memory leaks.
So if that is your main reason for using it, be sure to check that out first.
I only know about MSVC Visual C++ - and in that case, it is done as follows:
First, in the #defines for your project, or in a header to be included with every source file that does memory allocation you have:
#define _CRTDBG_MAP_ALLOC
#include <crtdbg.h>
Now at the start of your WinMain you need to use:
_CrtSetDbgFlag ( _CRTDBG_LEAK_CHECK_DF | _CRTDBG_ALLOC_MEM_DF | _CRTDBG_CHECK_ALWAYS_DF );
Now when running in debug mode, when the program exits the Output window will show any memory leaks detected and the line number and file where they were first allocated.
Using MemLeakCheck in ones own source code does have certain advantages even so, and in fact in practice I still use it myself.
For one thing, you can edit the code to add more diagnostics should you wish to do so. You can also set a break point to catch wild pointers deallocation immediately, and step into it when memory is allocated and freed to have a better idea of what is happening, e.g. how many allocations have been made so far (and more diagnostics could be added here to make this more useful).
How to use it as source code
Include the source code and header itself with your app.
To do it that way, uncomment these lines in the header.
#define cl_mem_leak_check // for the auto free
#define cl_mem_leak_diagnostics // if you want the diagnostics
Comment out the ones about building or linking with dlls. If your app is a multithreaded windows app then uncomment:
#define MAKE_WINDOWS_THREAD_SAFE
Place the header at the head of every file that uses memory allocation - but after your #includes for the standard libraries.
Finally, once you have done all the allocation and freed all the memory you know about at the end, then call
MemLeakCheckAndFree();
This will show a diagnostics report if it found any pointers still unallocated - and will free them. If you switch off diagnostics then this routine is the one that does the auto free for you.
The warnings are written to stderr as is useful for a console app. However if you are using it with a windows program you would make your own call back routines to handle the warnings:
SetMemLeakWarnProc(MemLeakWarnProc);
and
SetMemLeakLogProc(MemLeakLogProc);
This is used if a potentially long list of warnings needs to be shown - typically one might write those to a file. Here is what its output might look like:
************************************************************
2 PM Saturday, July 12, 2003 GMT Daylight Time
************************************************************


Memory Leak!
File: I:\Lissajous\main.c, line 46, size 100
File: I:\Lissajous\main.c, line 248, size 1000
Examples of these routines suitable for Windows programs are included in the header.
The code is set up to work with the most commonly used malloc type routines. However, if you use other allocation methods which need to be freed using free(...) e.g. wcsdup in windows to duplicate two byte character strings, then you need to add these as new routines to MemLeakCheck. That is easily done in this case by following the example for strdup and using wcslen and wcscpy in place of strlen and strcpy.
Alternative approach with redefined malloc etc
Perhaps it isn't easy to put the header in between the includes for the standard libraries and your source code.
In that case you may like to use the older approach of this dll, which you get if you add in:
#define code_uses_redefined_malloc
Then in your source code, do a search and replace and change:
 malloc to _malloc_
 free to _free_
 calloc to _calloc_
 realloc to _realloc_
 strdup to _strdup_
(prefixed and suffixed by underscores)
Note that there will be no need to change them back again later. When you want to revert to normal malloc etc, just retain the header and switch off the diagnostics and memory leak check and all will be back to normal.
Switch them on again whenever you want to do the diagnostics. If you use this approach, remember to use the underscores whenever you add new calls to malloc etc to your code as you will need those if you will ever want to do the diagnostics again.
Using MemLeakCheck as a dll
The other way to use it is as a dll - this has the advantage that you don't need to edit the source code of the calling app.
Link with the relevant dll, either MemLeakCheckt.dll, for diagnostics, or MemLeakCheckta.dll, to auto free only (add the relevant .lib file to your linker options)
Now include the header after all your standard includes and before your own source code where the allocation and free occurs.
In the header, define
#define LINK_MEMLEAK_CHECK_AS_DLL
Then, if you are linking with MemLeakCheckt.dll, you need to define
#define cl_mem_leak_check
#define cl_mem_leak_diagnostics
or for MemLeackCheckta.dll, just define the cl_mem_leak_check
and you will be in business.
Since you may very well use a different version of the c run time library from the DLL (whether single or multithreaded, release or debug), it might be an idea to add this code at the end of one of your source files after all the memory allocations:
#ifdef cl_mem_leak_diagnostics

#undef malloc
#undef calloc
#undef realloc
#undef memcpy
#undef free
#include "malloc.h"

void init_memleakcheck_alloc(void)
{
 set_mlc_malloc(malloc);
 set_mlc_calloc(calloc);
 set_mlc_realloc(realloc);
 set_mlc_free(free);
 set_mlc_memcpy(memcpy);
 set_mlc_strlen(strlen);
 set_mlc_strcpy(strcpy);
}

#endif
Then call init_memleakcheck_alloc() when your program starts up, and before you do any memory allocations.
I've tested it without and it seems to run fine (not like file pointers where using a file pointer in a different c run time library causes an immediate access violation). However, perhaps one may as well do it this way. If anyone has more information about this subject, and about whether this is advisable, let me know.
To build the dll you comment out the LINK_MEMLEAK_CHECK_AS_DLL line and define
#define BUILD_MEMLEAK_CHECK_AS_DLL
Note when building the dll, the '\' continuation character at the end of many of the lines in the macro definitions is essential.
So make sure you use the text of the source code verbatim. If you get compile errors, then first check to make sure that those characters haven't got stripped, e.g. in
#define SPIN_AND_GET_ACCESS \
{\
...
}.
Details of how it works
The idea was that when the calling app wants to allocate some memory, you allocate just a little more than is actually needed. E.g. if 100 bytes are required, allocate 116 bytes (in diagnostic mode).
Use the first 16 bytes for the structure with the diagnostic information. Keep a record of all the pointers allocated in an array. The diagnostic information includes a record number which will let you speedily look up the record when you want to free it, without any need to search - just go straight to that array index. This is the idea which makes this method a fast one, with no appreciable speed penalty at all in most situations.
Then instead of giving the pointer from malloc to the calling app, return your new pointer offset by 16 bytes, so the calling app only sees the new memory starting at a position just beyond the section with the diagnostic info.
When the calling app gives you a pointer to free, first decrement it by 16 bytes to get to the original pointer value you allocated, examine the structure to find its record number, then free it, and set its array entry to NULL as a signal that the memory has now been freed.
In the non diagnostic auto free mode, all you need is 4 bytes for the record number (the other 6 bytes or so per pointer in auto free mode are needed for the array which keeps a list of all pointers allocated)
Every 1000 or so allocations, you compactify the array of pointers allocated - just move all the records back to fill any gaps - update the entries in the first 16 (4) bytes of each pointer as you do so so that the record numbers remain valid.
Once this array is large, instead, compactify just when its size increases by 150 percent (say). Since this is done infrequently it has little impact on speed. You would need to be doing very very many small allocations and to be coding for extremely time critical processing for this to be an issue.
If it was ever an issue, one could address it. One could add an option to temporarily switch off the compactification whenever you are doing some particularly time critical task.
For diagnostics, you just inspect the array of records to see if there are any non null entries left when the program exits. To test for wild pointers - if you get given back a pointer that doesn't have the data you expect after decrementing it by 4 bytes - when you inspect the memory location you get either an out of range index for the array - or the index into the array retrieves a pointer that doesn't match the one you have - then you know it is a wild pointer and again do a diagnostic report on that if in diagnostic mode.
Source code
So anyway without further ado, here it is. It should be easy enough to read I hope. Includes the source code and also two versions of the dll - with and without the diagnostics.
memleakcheck.zip [57 KB]
This is free source - do with it as you like. Treat it as you would a demo program in a c programming book.
Here it is as an MSVC project with a small test program that allocates various pointers and doesn't free it, and also tries to free a wild pointer. It is the test program used for the first screen shot above.
Changes
Contact e-mail:
Robert Walker support@tunesmithy.co.uk
July 19th
Tidied up the header a bit, added #define MLC_WARN_ON_ATTEMPT_TO_FREE_WILD_POINTER so you can switch this off if you like, and gave an example to show how to set the warning proc to use OutputDebugString() if one wants to send the warnings to your debugger's output window in Windows instead of to the console or as a windows message. Note that you don't need to free memory on exit from a program in Windows as Windows will do it automatically and I was wrong about my earlier remark that one needs to do this. See discussion at: Code Project: Mem Leak Check Article
First release July 12th 2003:
A few hours after the initial release I followed my own instructions in the section on multi threading to make it thread safe for windows.
Then another few hours later did some work improving the code and added the option for a user to set their own routines for memory allocation, and free. This was done originally because I thought that the pointers couldn't be passed between different C Run Time versions - but it seems on testing that they can (unlike FILE pointers which only work with the CRT they originated in).
However maybe this option may be useful so it is retained. To use it see the example code in the section above on Using MemLeakCheck as a dll.